When the Dow tumbled more than 500 points yesterday, the worry and concern that the largest economy powerhouse may collapse reappears. Frankly, it isn’t that difficult to imagine that the U.S. dollar may collapse due to the huge debts and deficits. Historically there are many examples on how hyperinflation drove a country to total disarray. World war and economic mismanagement were the major factors that contributed to the once powerful currencies to become worthless in a matter of couple of years.
Hence the question – will U.S. dollar become worthless and join these list of these worthless currencies? Many Americans as well as non-Americans do not believe so simply because the U.S. is too big a giant to fail. Well, basically it makes perfect sense to believe such a theory. I believe while the U.S. dollar may collapse, the time is not now. Not when there’s no other alternative to replace the U.S. dollar as the most stable and the most liquid financial asset in the world. In fact, there’s not a single case from the past currencies that have gone bust that had the same storyline as the current United States.

The clever and amazing story that is preventing the U.S. dollar from collapsing, despite the fact the country has a mind-boggling debt of over US$14 trillion, is that the country successfully spread its debt to all major countries worldwide. The fact that the foreign funds are holding about 46% of U.S. Treasury and can’t do anything except bitching about the U.S. debt goes to show the U.S. dollar is still far from collapsing. You can’t find such story in any of the other currencies that have gone bust. So how here’re the short story how other 21 currencies depreciated to worthless papers.
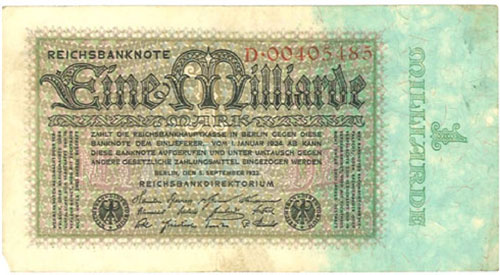
1) Germany – 1 billion mark, 1923

From 1914, the rate of inflation rose following the end of World War I and the value of the Mark fell and reached its highest point in October 1923. The Mark was no longer tied to gold and the hyperinflation in 1923 saw the German Governement printed lots of the banknotes as much as possible to pay its war debt. Many Germans literally carted wheelbarrows of cash to pay for groceries.
In 1922, the highest denomination was 50,000 Mark but by 1923, the highest denomination was 100,000,000,000,000 Mark. In December 1923 the exchange rate was 4,200,000,000,000 Marks to 1 US dollar. In 1923, the rate of inflation hit 3.25 × 10⁶ percent per month (prices double every two days). Beginning on 20 November 1923, 1,000,000,000,000 old Marks were exchanged for 1 Rentenmark so that 4.2 Rentenmarks were worth 1 US dollar, exactly the same rate the Mark had in 1914.
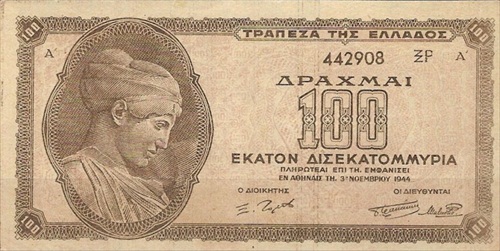
2) Greece – 100 Billion Drachmai, 1944

During World War II occupation by Nazi Germany in 1941-1944, the rate of inflation hit 8.55 x 10⁹ percent per month when prices doubled every 28 hours. As a result, the 100 Milliard, or 100 Billion Drachmai note was issued in November 1944. Although this note only displays 2 zeroes, it still contained a hefty denomination.
3) Hungary – 100 Quintillion Pengo, 1946
 After the end of World War II, Hungary’s hyper-inflation was so serious that it was peaking at 4.19 × 10¹⁶ percent per month (prices doubled every 15 hours) – the most severe known incident of inflation. In order to keep up with the inflation rate, the government issued the 100 Million B-Pengo note in 1946. A B-Pengo is equal to one billion pengo, but in European terms a billion is equal to one-thousand milliard, or one trillion in American terms. Therefore, the 100 Million B-Pengo is essentially equal to 100,000,000,000,000,000,000 (100 quintillion) Pengo. It was worth about U.S. $0.20 in 1946. Eventually, 29 zeroes were dropped when the Forint was adopted in mid-1946.
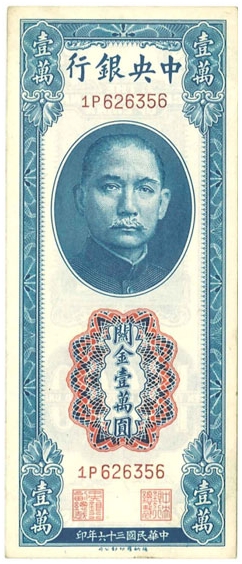
4) China – 10,000 CGU, 1947

The customs gold unit (CGU) was a currency issued by the Central Bank of China between 1930 and 1948. CGU was defined as equal to 601.866 mg fine gold or US$0.40. CGU notes were fully backed by silver and were legal tender for paying import duties. In 1930 Central Bank of China put into circulation notes in denominations of 0.10, 0.20, 1, 5, and 10 CGU and by 1942, 20 and 50 denominations were released. In Jan 1947, Central Bank of China released notes of 250 and 500 CGU but inflation forced higher denominations from 1,000 to 250,000 in 1948. Strangely, this CGU looks more like the lable you see on Chinese medicine bottle, like the Pil Chi Kit Teck Aun, than a valid currency (*grin*).
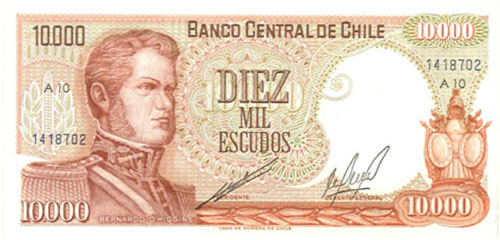
5) Chile – 10,000 pesos, 1975

Beginning in 1971, during the presidency of Salvador Allende, Chilean inflation began to rise and reached peaks of 1,200% in 1973. As a result of the hyperinflation, food became scarce and overpriced. A 1973 coup d’état deposed Allende and installed a military government led by Augusto Pinochet. Pinochet’s free-market economic policy ended the inflation. In 1976, banknotes were introduced in denominations of 5, 10, 50 and 100 pesos with the reverses of the 5, 10 and 50 peso notes resembling those of the 5000, 10,000 and 50,000 notes they replaced. Inflation has since led to the issue of much higher denominations, from 500 pesos (1977) to 20,000 (1998).
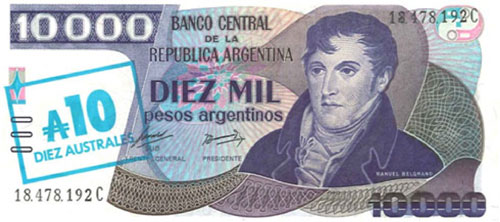
6) Argentina – 10,000 pesos argentinos, 1985

Argentina experienced high inflation from 1975-1991. At the beginning of 1975, the highest denomination was 1,000 pesos but in late 1976, the highest denomination was 5,000 pesos. From early 1979 to end of 1981, the highest denomination jumped from 10,000 pesos to 1,000,000 pesos. In the 1983 currency reform, 1 peso was exchanged for 10,000 pesos. In the 1985 currency reform, 1 austral was exchanged for 1,000 pesos argentinos and in another currency reform in 1992, 1 new peso was exchanged for 10,000 australes. The overall impact of hyperinflation: 1 (1992) peso = 100,000,000,000 pre-1983 pesos.
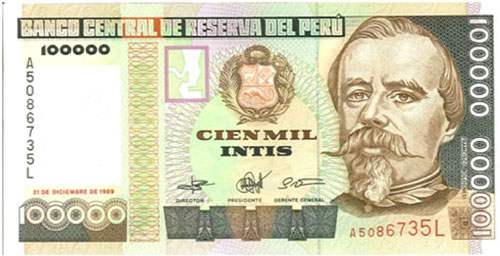
7) Peru – 100,000 intis, 1989

The inti was introduced on 1 February 1985, replacing the sol which had suffered from high inflation. One inti was equivalent to 1,000 soles and notes introduced were in denominations of 10, 50, 100 and 500 intis. The next year, 1,000 intis notes were added, followed by 5,000 and 10,000 in 1988. In September 1988 alone, monthly inflation went to 132% and in August 1990, monthly inflation was at 397%. From 1989 to mid-1990, 50,000, 100,000, 500,000, 1 million and 5 million intis notes were added. By 1990, the inti had suffered from bad high inflation so much so that a new sol (nuevo sol) was adopted on July 1991 replacing the inti at an exchange rate of a million to one.
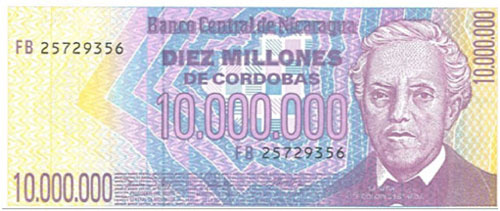
8 ) Nicaragua – 10 million córdobas, 1990

Due to high inflation, National Bank of Nicaragua overprinted and reprintedmany banknote with higher value during the period of the late 1980s. In 1989, notes for 20,000 and 50,000 córdobas were introduced, followed the next year by 5 million and 10 million córdobas notes.
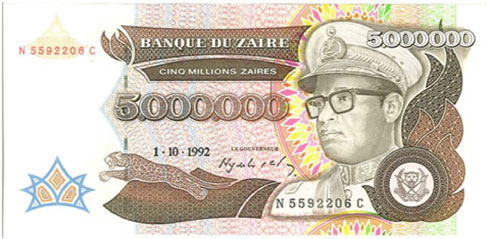
9) Zaire (now Congo) – 5 Million zaïres, 1992

Zaire went through a period of inflation between 1989 and 1996. In 1988, the highest denomination was 5,000 zaïres but by 1992, it was 5,000,000 zaïres. In the 1993 currency reform, 1 nouveau zaïres was exchanged for 3,000,000 old zaïres. The highest denomination in 1996 was 1,000,000 nouveaux zaires. In 1997, Zaire was renamed the Congo Democratic Republic and changed its currency to francs. 1 franc was exchanged for 100,000 nouveaux zaires. The overall impact of hyperinflation: 1 franc = 3 × 10¹¹ pre 1989 zaires.
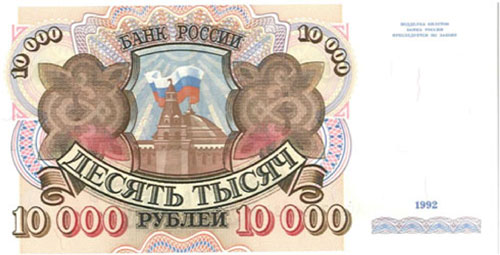
10) Russia – 10,000 rubles, 1992

Following the breakup of the Soviet Union in 1991, the ruble remained the currency of the Russian Federation. Between 1921 and 1922, inflation in Soviet Russia reached 213%. In 1992, the first year of post-Soviet economic reform, inflation was 2,520%. In 1993, the annual inflation rate was 840% and in 1994, 224%. A new set of banknotes was issued in the name of Bank of Russia in 1993. During the period of hyperinflation of the early 1990s, the ruble was significantly devalued. In actual fact, Russia has gone through many rounds of redenomination from 1922 to 1998. The ruble lost 70% of its value against the U.S. dollar in the six months following the 1998 Russian financial crisis.
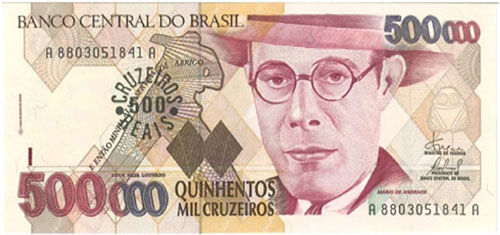
11) Brazil – 500 cruzeiros reais, 1993

From 1986-1994, the base currency unit was shifted three times to adjust for inflation in the final years of the Brazilian military dictatorship era. A 1967 cruzeiro was, in 1994, worth less than one trillionth of a US cent, after adjusting for multiple devaluations and note changes. In that same year, inflation reached a record 2,075.8%. A new currency called real was adopted in 1994 and hyperinflation was eventually brought under control. The real was also the currency in use until 1942; 1 (current) real is the equivalent of 2,750,000,000,000,000,000 of old reals (called réais in Portuguese).
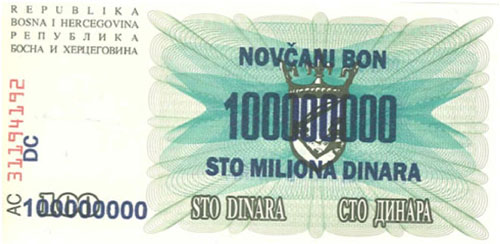
12) Bosnia – 100 million dinar, 1993

Bosnia and Herzegovina went through its worst inflation in 1993. In 1992, the highest denomination was 1,000 dinara. By 1993, the highest denomination was 100,000,000 dinara. In the Republika Srpska, the highest denomination was 10,000 dinara in 1992 and 10,000,000,000 dinara in 1993. 50,000,000,000 dinara notes were also printed in 1993 but never issued.
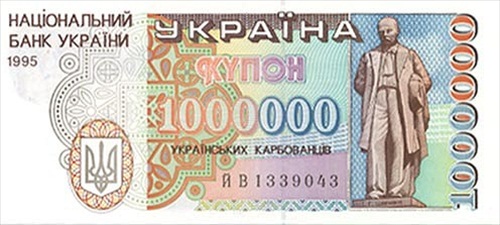
13) Ukraine - 1 million karbovanets, 1994

Ukraine went through its worst inflation between 1993 and 1995. In 1992, the Ukrainian karbovanets was introduced to replace the defunct Soviet ruble at a rate of 1 UAK = 1 SUR. Before 1993, the highest denomination was 1,000 karbovantsiv. By 1995, it was 1,000,000 karbovantsiv and in 1996, during the transition to the Hryvnya and the subsequent phase out of the karbovanets, the exchange rate was 100,000 UAK = 1 UAH. This translates to a hyperinflation rate of approximately 1,400% per month. To this day Ukraine holds the world record for the most inflation in one calendar year, which was set in 1993.
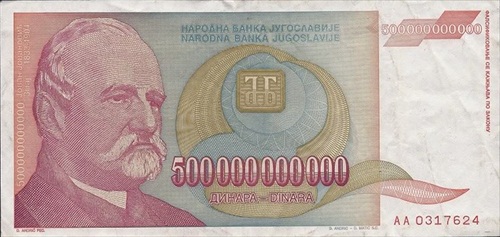
14) Yugoslavia – 500 Billion Dinar, 1994

Yugoslavia hit a very high inflation rate between 1 Oct 1993 and 24 Jan 1994, so much so that the prices actaully doubled every 16 hours. The rate maxed 323% per month and the highest value of its currency issued in Dec 1993 was a 500 Billion Dinar note, which was valued at about US$6 on the day the note was issued but quickly erased by 50% to only US$3 by evening.
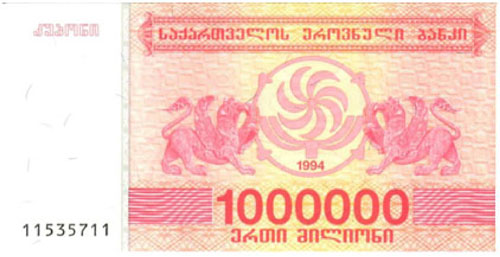
15) Georgia – 1 million laris, 1994

After declaring its independence on April 9, 1991, Georgia continued to use the Russian Ruble (RUR) until June 11, 1993 when the Russian Ruble ceased to be legal tender. The Georgia Kupon Larit replaced the Russian Ruble on April 5, 1993 at par. However, Georgia suffered severe inflation, and the Larit (GEL) replaced the Kupon Larit on September 23, 1995 with 1 Larit equal to 1,000,000 Kupon Larit.
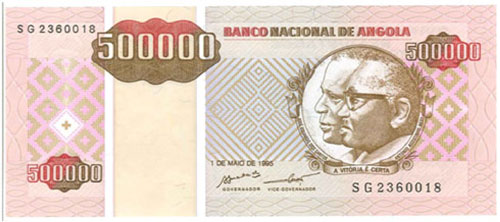
16) Angola – 500,000 kwanzas reajustados, 1995

Angola went through major hyperinflation from 1991-1995. It was a result of exchange restrictions following the introduction of the novo kwanza (AON) to replace the original kwanza (AOK) in 1990. At the first months of 1991, the highest denomination was 50,000 AON but by 1994 the highest denomination was 500,000 kwanzas. In the 1995 currency reform, the readjusted kwanza (AOR) replaced the novo kwanza at the ratio of 1,000 AON to 1 AOR, but hyperinflation continued as further denominations of up to 5,000,000 AOR were issued. In the 1999 currency reform, the kwanza (AOA) was reintroduced at the ratio of 1 million AOR to 1 AOA. Currently, the highest denomination banknote is 2,000 AOA and the overall impact of hyperinflation was 1 AOA = 1 billion AOK.
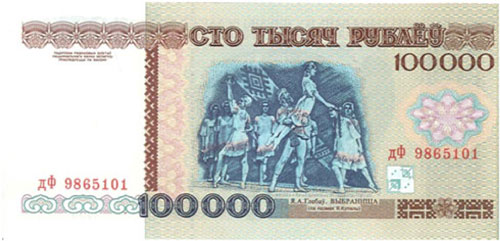
17) Belarus – 100,000 rubles, 1996

Belarus went through steady inflation from 1994-2002. In 1993, the highest denomination was 5,000 rubles but by 1999, it was 5,000,000 rubles. In the 2000 currency reform, the ruble was replaced by the new ruble at an exchange rate of 1 new ruble = 1,000 old rubles. The highest denomination in 2008 was 100,000 rubles, equal to 100,000,000 pre-2000 rubles.
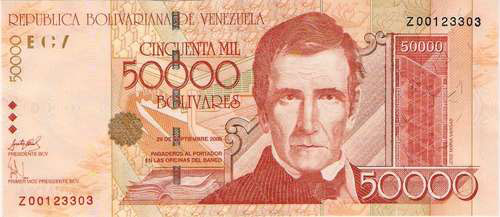
18) Venezuela – 50,000 bolívares, 1998

In 1940, Central Bank of Venezuela began issuing paper money and by 1945, it introduced denominations of 10, 20, 50, 100 and 500 bolívares. As inflation took hold, higher denominations of banknotes started being introduced: 1,000 bolívares in 1991, 2,000 and 5,000 bolívares in 1994, and 10,000, 20,000 and 50,000 bolívares in 1998.
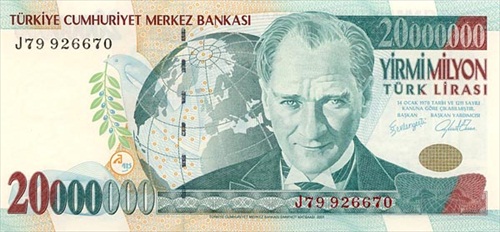
19) Turkey – 20 Million lira, 2001

Turkey’s lira was pegged to the British pound, French franc and later the U.S. dollar. After 1960, the currency was devalued at 9 lira to 1 dollar but since then the currency weaken to a mind-boggling 1.65 million lira to 1 dollar in late 2001, an inflation of 40% annually, thanks to inflation from the 1970s through 1990s. The Guinness Book of Records even ranked the lira as the world’s least valuable currency in 1995 and 1996, and again in 1999 through 2004. From 5,000 lira in 1981, Turkey issued 20,000,000 lira in 2001
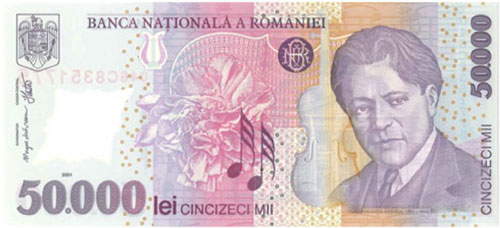
20) Romania – 50,000 lei, 2001

In the 1990s, after the downfall of communism, inflation ran high due to reform failures, the legalization of owning foreign currency in 1990, and the bankrupt policies of the former communist era – reaching rates as high as 300% per year in 1993. By September 2003, one euro was exchanged for more than 40,000 lei, this being its peak value. Romanian’s highest denomination was actually a 5 Million note from 1947. Romanian Government has done couple of revaluation rounds to psychologically bringing the purchasing power of the lei back in line with those of other major Western currencies.
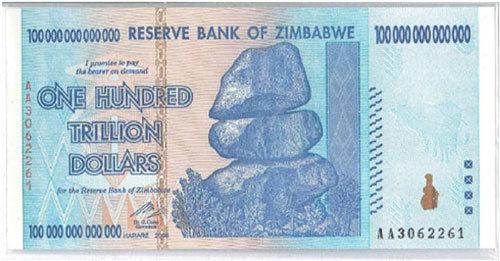
21) Zimbabwe – 100 Trillion Dollar, 2006

Zimbabwe Government under President Robert Mugabe issued a 100 billion dollar bank note in July 2008. In January 2009, however, a 100 Trillion Dollar note was released – Zimbabwe’s highest denomination note and the biggest ever produced for legal tender. This instantly made Zimbabwe a country that produced bank note with the most zeroes (14 zeroes). Interestingly the 100 Trillion Dollar note, which was worth about US$5, couldn’t buy a bus ticket in the capital of Harare. However 100 Trillion Dollar which was equivalent to about US$300 could buy a loaf of bread.
At independence in 1980, the Zimbabwe dollar (ZWD) was worth about US$ 1.25. However, rampant inflation and the collapse of the economy (corruption) have severely devalued the currency, causing many organisations to favour using the US dollar or South African rand instead. Inflation was stable until President Mugabe began a program of land reforms that primarily focused on taking land from white farmers and redistributing those properties and assets to black farmers – this in turn sent food production and revenues from export of food plummeting.
By 2004, Zimbabwe started to experience chronic inflation. It’s Inflation reached 624% in 2004, then fell back to low triple digits before surging to a new high of 1,730% in 2006. By June 2007, inflation in Zimbabwe had risen to 11,000% year-to-year from an earlier estimate of 9,000%. Reserve Bank of Zimbabwe took the easy way by issuing bank notes or “bearer cheques” with face value from ZWN 100 million to 100 billion. Meanwhile, inflation officially surged to 2,200,000% with some analysts estimating figures surpassing 9,000,000% (please don’t fell off your chair, *grin*).

As of 22 July 2008 the value of the ZWN fell to approximately 688 billion per 1 USD. On 19 August 2008, official figures announced for June estimated the inflation over 11,250,000% and by July, the inflation skyrocket to 231,000,000% (prices doubling every 17.3 days). Eventually it was calculated that Zimbabwe’s monthly inflation peak at the rate of 79.6 billion percent or 98% daily rate – prices were doubling every 24.7 hours. Now, we now why Malaysian former dictator Mahathir Mohamad loves Robert Mugabe so much.
Mahathir was simply thrilled with the capability of Mugabe in managing Zimbabwe’s economy, although it failed to surpass Hungary’s 1946 inflation world record. Birds of the same feather flock together, huh? Now, be aware instead of jumping in joy when the government announce higher denomination note(s) to be introduced into the country.